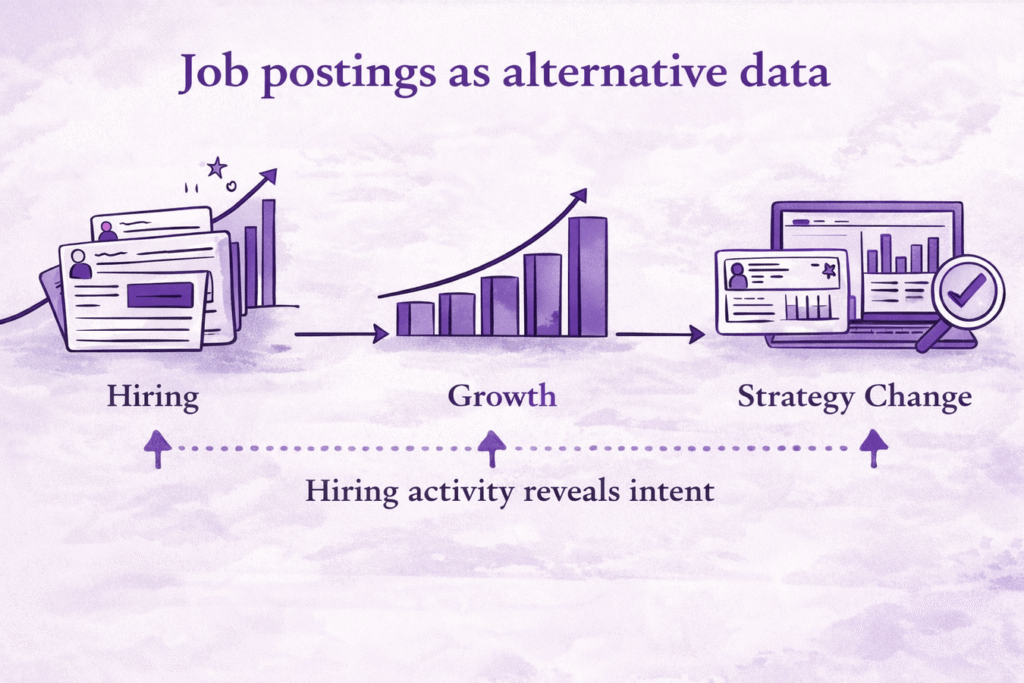
Job Postings as Alternative Data: Why Hiring Activity Reveals Real Company Intent

Estimated reading time: 4 minutes

Most company data explains what a business is, but the sad reality is that very little explains what it is changing.

Revenue ranges, headcount bands, and industry labels stay the same for long periods of time. Hiring activity does not. When a company opens roles, it signals budget approval, internal priorities, and upcoming operational work.

This is why job postings have become one of the most reliable sources of alternative data.

Job postings used as alternative data to show hiring activity, company growth, and strategy change over time
Hiring activity reveals company intent, growth patterns, and strategic change over time.

What a Jobs Dataset actually represents

Jobs Dataset explained

A Jobs Dataset collects job postings published by companies and structures them into data that can be analyzed over time.

The goal is not to help candidates find roles.
The goal is to observe company behavior.

Each posting reflects a decision that already passed internal approval: someone agreed to spend money and add capacity.

What hiring activity tells you

Job postings indicate:

  • where budget is being allocated
  • which teams are growing
  • what problems the company is trying to solve
  • how close the company is to execution

Viewed in isolation, a job posting is just a role. Viewed across time and across departments, it becomes a signal.

PredictLeads tracks hiring activity across millions of companies, allowing both current monitoring and historical comparison.


Why hiring data beats company profiles

Profiles describe. Hiring shows movement.

Firmographic data answers basic questions:

  • size
  • industry
  • location

Hiring data answers different ones:

  • which team is expanding
  • whether growth is steady or temporary
  • how priorities are shifting

A company can fit an ICP definition for years without buying anything. Hiring introduces timing.

Timing changes outcomes

A company hiring RevOps, data engineering, or security roles is in a different position than one that is not hiring at all.

That difference affects:

  • outreach relevance
  • deal likelihood
  • research accuracy

Jobs data helps decide when to engage, not just who to list.


Hiring as intent you can verify

Interest versus commitment

Some signals show curiosity. Others show action.

Reading content or searching keywords costs nothing. Opening a role costs money.

Examples:

  • Sales Ops roles point to go-to-market investment
  • Data engineering roles point to internal data work
  • DevOps roles point to scaling infrastructure
  • Security roles point to compliance pressure

Each role maps to a real internal need. That need already has funding behind it.


Why Jobs data works as a predictive signal

The value is in patterns, not posts

Single job postings are noisy. Patterns are not.

A strong Jobs Dataset allows analysis of:

  • how often roles are opened
  • which departments grow together
  • whether hiring continues or stops
  • where teams are being built

These patterns help distinguish:

  • growth from maintenance
  • short experiments from long-term plans
  • readiness to buy from internal build phases

That is why hiring data supports scoring and prioritization instead of simple enrichment.


Practical use cases for a Jobs Dataset

Sales and outbound

Jobs data helps sales teams:

  • focus on companies with active budget decisions
  • align outreach with team needs
  • avoid accounts showing no momentum

Outreach becomes event-driven instead of list-driven.

Account scoring

Hiring volume, role mix, and recency can be combined to:

  • surface expansion signals early
  • deprioritize inactive accounts
  • support objective account ranking

Market and ICP analysis

Jobs data shows:

  • which roles appear in which industries
  • how functions evolve over time
  • whether assumptions about buyers hold up in practice

This is useful for strategy, not just targeting.

Investment and research

Hiring trends often move before financial metrics.

Jobs data helps researchers:

  • spot early-stage growth
  • compare companies with similar profiles
  • monitor changes without relying on announcements

Why historical hiring data matters

Looking at hiring once tells you very little.

What matters is:

  • consistency
  • direction
  • change

Companies that hire steadily behave differently from those that hire in bursts. Declines often show up in hiring before they show up elsewhere.

PredictLeads provides historical Jobs data so trends can be measured, not guessed.


How the PredictLeads Jobs Dataset is designed

The PredictLeads Jobs Dataset is:

  • structured and machine-readable
  • accessible through API and exports
  • built for automation and analysis
  • independent of any proprietary workflow

It fits into existing data, GTM, and research systems without forcing process changes.


Conclusion

Job postings are not just recruitment noise; they are clear economic signals.

A Jobs Dataset shows:

  • where money is being spent
  • which teams are expanding
  • when companies are preparing for change

For alternative data use cases, hiring activity remains one of the earliest and most reliable indicators of company intent.

About PredictLeads

PredictLeads is a data company that tracks how companies change over time by observing real actions such as hiring, technology adoption, and company events across 100 million businesses worldwide.
It provides this data as a flexible, API-first layer that teams can use inside their existing sales, GTM, research, and investment workflows to understand timing, intent, and momentum.

PredictLeads × Make: Automate Company Data Across Your Stack

Build no-code workflows with Make and turn company data into action

PredictLeads is now officially available on Make as a verified, vendor-maintained app, allowing you to connect PredictLeads with thousands of tools and automate GTM, sales, and research workflows & all this without writing code. This PredictLeads Make integration simplifies processes and enhances productivity.

If you already use PredictLeads data, this is the fastest way to operationalize it.
If you don’t, this is the easiest way to start.

Promotional graphic announcing a new integration between PredictLeads and Make. Purple background with PredictLeads and Make logos centered, text reading ‘Integrate PredictLeads data into any workflow,’ and icons of connected tools like HubSpot, Google Sheets, Salesforce, Pipedrive, Slack, and others.
PredictLeads data, now fully automatable with Make.
Build, trigger, enrich, and route company intelligence anywhere.

Why this matters

PredictLeads has always been a data provider, not a platform.
Our focus is delivering high-quality company data via APIs — and letting you decide how to use it.

With Make, you can now:

  • Pull PredictLeads data into your existing tools
  • Automate workflows across sales, marketing, ops, and research
  • Skip custom engineering and ship workflows in hours, not weeks

No UI lock-in. No rigid workflows. Just data, activated where you already work.


Official PredictLeads app on Make

The PredictLeads app on Make is:

  • Verified by Make
  • Developed and maintained by PredictLeads
  • Production-ready for real customer workflows

You can get started for free:

  • No credit card required
  • No time limit on the Free plan

What you can build with PredictLeads on Make

Make works with triggers, searches, and actions.

Company intelligence

  • Get a Company
  • Search Companies (by location, size)
  • Search Similar Companies
  • Search Company Connections
  • Search Company Website Evolution

Hiring & jobs

  • Get a Job Opening
  • Search Job Openings (by role, O*NET codes, location)
  • Search Company Job Openings

News & signals

  • Get a News Event
  • Search Company News Events
  • Search Latest Posts

Technologies & products

  • Get a Technology
  • Search Company Technologies
  • Search tracked Technologies
  • Get a Product
  • Search Company Products

Financing & portfolio data

  • Search Company Financing Events
  • Search Portfolio Companies

Developer & advanced usage

  • List API subscription information
  • Make an API Call (full flexibility for advanced workflows)

Connect PredictLeads with your favorite tools

Once connected, you can plug PredictLeads into tools like:

  • Google Sheets
  • HubSpot CRM
  • Notion
  • Airtable
  • Slack
  • Gmail / Outlook
  • ClickUp
  • OpenAI (ChatGPT, Whisper, DALL-E)
  • Google Docs & Drive
  • Telegram
  • Stripe
  • Shopify
  • WordPress
  • And thousands more via Make

This makes PredictLeads a central data layer across your GTM stack.


Example workflows teams are building

Here are a few common patterns we’re seeing:

  • Sales
    Identify companies hiring for a specific role → enrich in HubSpot → notify SDRs in Slack
  • Marketing
    Track companies launching new products → log events in Notion → trigger content ideas
  • RevOps / Data teams
    Monitor technology adoption → push updates to Sheets or BI tools
  • Investors & research teams
    Track portfolio companies → alert on news, hiring, or tech changes

All without custom scripts.


Why Make (and not another platform)

We see Make as a natural fit because:

  • It’s visual and no-code
  • It scales from simple workflows to complex orchestration
  • It plays well with APIs and external data sources
  • It doesn’t force PredictLeads into a “platform UI” model

You stay in control of your workflows.


Get started

You can start building immediately:

  • Connect PredictLeads on Make
  • Authenticate with your API key
  • Choose a module and start building

No credit card. No time pressure.

If you want help designing your first workflow, or want examples tailored to your use case (sales, VC, GTM, ops), reach out — we’re happy to help.


PredictLeads is a B2B data provider that tracks millions of companies globally, delivering structured signals like hiring, technologies, news, and growth indicators via APIs and datasets—so teams can power sales, marketing, and investment workflows with real company intelligence.

How to Do Modern Competitor Research Using Digital Signals

For a comprehensive understanding, a data-driven competitor research guide can be essential. Competitor research used to be slow, manual work: reading websites, analyzing press releases, and relying on outdated industry reports. Today, companies leave behind a rich trail of digital signals that reveal how they operate, what they prioritize, and where they’re heading next.

This guide walks through a practical approach to understanding competitors using publicly observable behavior, not guesswork.


1. Identify Competitors Through Behavior, Not Labels

Competitors are not just companies in the same category. They’re companies that:

  • Attract the same customer segments
  • Integrate with the same tools
  • Solve adjacent problems
  • Compete for the same talent
  • Operate in the same ecosystem

Start by looking at patterns such as shared partnerships, similar hiring needs, and overlapping product capabilities. This produces a more realistic picture of who you’re actually competing with — not just who marketing says you compete with.


2. Analyze Their Positioning Through Public Metadata

A company’s website, job postings and product documentation reveal who they sell to and how they see themselves in the market.

Look for signals like:

  • Industry focus (based on customer stories, partnerships, and sales roles)
  • Whether they target SMBs, mid-market or enterprise
  • Whether they rely on direct sales, PLG, channel sales, or integrations
  • Geographic expansion (where new roles or offices appear)

This creates a baseline view of each competitor’s market position.


3. Track Strategy Shifts Before They Become Official

Competitors rarely announce their roadmap — but they hint at it constantly.

Strategy can be inferred from:

  • Leadership hires (e.g., AI leads, compliance officers, regional managers)
  • Team expansions or contractions
  • Funding events
  • Partnerships with ecosystem vendors
  • Shifts in skill requirements across job descriptions
  • Adoption of new technologies
  • Changes in messaging or site structure

These early signals often appear months before a formal launch, new line of business, or market entry.


4. Study Their Customers and Partners

Understanding who buys from a competitor — and who they choose to partner with — is one of the most powerful components of competitive research.

Customer and partnership information can come from:

  • Customer logo sections
  • Case studies
  • Integration directories
  • Partner pages
  • Co-marketing announcements
  • Public reference lists
  • Marketplace listings

This reveals the industries they perform well in, the ecosystems they depend on, and the companies that amplify or distribute their product.


5. Infer Product Direction From Hiring and Technology Choices

Two of the clearest windows into how a product is evolving are:

Hiring patterns

Job postings show what capabilities a company is building next.
Examples:

  • AI and ML roles → automation or intelligent workflows
  • Backend & infra roles → platform rebuilds or scale prep
  • Compliance roles → enterprise push
  • Growth & lifecycle → PLG investment

Technology stack changes

New technologies adopted by a company often serve as “breadcrumbs” pointing toward upcoming product features, modernization efforts, or market expansions.

Together, these signals form a high-resolution picture of where a competitor is heading.


6. Group Competitors Into Clusters

Once the signals are collected, organize competitors by similarity.
Clusters might form around:

  • Product capabilities
  • Hiring patterns
  • Technology stack
  • Partnerships
  • Customer base
  • Market segment

This creates a landscape view: which companies are true peers, which are adjacent players, and which are emerging rivals.


7. Measure Market Momentum

The most important competitive insight is change over time.
Track how competitors evolve:

  • Are they hiring faster or slowing down?
  • Are they adding more partners or losing them?
  • Is their technology stack expanding?
  • Are they entering new markets?
  • Is their customer mix shifting?
  • Are they mentioned in more industry news?

Momentum helps identify which companies are rising, plateauing, or declining — a powerful indicator for strategic planning.


8. Turn Insights Into Action

Competitor research is useful only when it informs real decisions:

  • Positioning and messaging
  • Product roadmap priorities
  • ICP refinement
  • Pricing strategy
  • Sales enablement
  • Partnership decisions
  • Expansion roadmaps
  • Threat assessment

The goal isn’t to obsess over competitors — but to understand the landscape well enough to make confident, informed moves.


How PredictLeads Fits Into This Framework

PredictLeads sits at the end of this process as a data source that consolidates the signals described above.
Instead of manually collecting hiring patterns, technology adoptions, news events, funding activity, customer and partner relationships, or ecosystem behaviors, PredictLeads provides these as structured datasets with historical context.

This allows companies to apply the framework above without spending hundreds of hours gathering raw data. The analysis remains the same and the difference is that the inputs arrive clean, complete, and ready for use.

10 Ways Companies Can Use PredictLeads Similar Companies Dataset

PredictLeads Similar Companies Dataset identifies companies that closely resemble another company. This is done based on domain patterns, digital presence, and behavioral signals. This makes it a powerful engine for targeting, prioritization, and market mapping. Using the Similar Companies Dataset for targeting and market mapping ensures precise alignment with business goals.

Below are ten practical applications of the Similar Companies Dataset for targeting and market mapping.


1. Build High-Precision Lookalike Lists

Teams can generate lookalike targets based on actual similarity, not guesswork, effectively utilizing the dataset to conduct similar companies targeting and market mapping. This improves targeting accuracy and reduces time spent on low-fit accounts.

2. Strengthen Ideal Customer Profile (ICP) Development

By examining similarity clusters around top customers, teams can better define what a strong-fit company actually looks like, backed by data rather than opinion, aiding similar companies targeting and market mapping efforts.

3. Improve Lead Scoring and Prioritization

A high similarity score can be used as a ranking factor. Leads that resemble existing best customers automatically surface to the top, leveraging a similar companies dataset approach for market mapping and effective targeting.

4. Identify New Market Segments

Similarity patterns often reveal adjacent groups of companies teams may not be monitoring. This helps GTM teams explore new verticals or sub-segments with lower risk, thanks to the insights from a similar companies dataset.

5. Fuel Account-Based Marketing Campaigns

ABM works when target lists are highly focused. Lookalike companies help build Tier 1, Tier 2, or Tier 3 account lists that mirror winning customer profiles, benefiting directly from a similar companies dataset used in market mapping.

6. Accelerate TAM and Market Mapping

Similarity clusters provide a quick way to understand how a market is structured. Companies that group together often share needs, tools, and workflows. This enhances targeting strategies with similar companies datasets applied for effective market mapping.

7. Improve Competitive Research

Teams can analyze which companies resemble a key competitor and identify emerging entrants or indirect competitors that share similar characteristics, utilizing a similar companies dataset for better mapping of the market landscape.

8. Support Product-Led Growth Targeting

PLG teams can identify companies similar to their most active or highest-converting users; as a result, they can more effectively target those accounts for activation, onboarding, or upsell campaigns. Additionally, the Similar Companies Dataset becomes a crucial element in this broader market strategy.

9. Surface High-Potential Accounts Overlooked in CRM

Many strong prospects never get touched simply because they do not fit old filters. Lookalike analysis can reveal accounts hiding in plain sight, which can be targeted effectively using a similar companies dataset for precise market mapping.

10. Help Investors Find Deals Faster

VCs and investors can generate lookalikes for any strong-performing portfolio company. This produces instant deal pipelines of companies with similar traits and traction signals through the innovative use of a similar companies dataset targeting market dynamics.


Get started with the PredictLeads Similar Companies Dataset and unlock powerful insights for sales, marketing, GTM, and investment teams.
The dataset curently covers 18.5+ million companies and draws from all PredictLeads datasets, giving you a unified view of similarity based on real digital and behavioral signals.

Explore the full documentation here:
https://docs.predictleads.com/guide/similar_companies_dataset

Real-Time Data Personalization & How it Improves Cold Outreach

Real-Time Data Personalization isn’t a buzzword but the foundation of truly relevant cold outreach. Most sales emails today pretend to be personal, but the timing is off. The message doesn’t match what the company is doing right now, which is why responses are low even when messaging is “customized.”

This article explains how real-time job openings and real-time news events create the context that makes outbound feel natural instead of random. When outreach reflects what’s actually happening inside a company, the message doesn’t just stand out but also benefits from effective personalization based on real-time data.

To go deeper into how PredictLeads structures this data, you can explore our documentation.
PredictLeads Docs

News event data powering real-time outreach personalization

Jobs Reveal What Companies Are Building Right Now

New job openings are one of the strongest real-time signals in B2B. When a company posts a role, it tells you exactly where they’re investing:

  • A team they’re scaling
  • A capability they lack
  • A bottleneck they’re preparing to solve
  • A geography they’re entering
  • A project they’re kicking off

Instead of generic outreach (“We help companies like yours…”), Real-Time Data Personalization lets you write outreach that reflects this immediate shift.

Example:
If a company suddenly opens several engineering or ops roles in one week, you know they’re getting ready up for a buildout (even before they say anything publicly.)


News Events Explain Why Those Roles Exist

Job data shows the what while News data shows the why.

Expansion announcements, new partnerships, funding rounds, layoffs, product launches. All these events offer context for the operational changes seen in job openings, allowing for real-time data personalization.

A company expanding into a new market?
You’ll see hiring in that region.

A company signing a large enterprise customer?
Support or onboarding roles usually appear.

A company restructuring?
Reductions in one function may be paired with increased hiring in another.

News events transform cold outreach from “I hope this resonates” into “I saw what’s happening, and here’s how I can help.”

For additional context categories, see this external guide.
News Events Categories


The Advantage Comes From Combining Both Signals

Real-time data personalization gets its power from aligning both signals:

  • Jobs → operational direction
  • News → strategic explanation

Together, they give you a timeline of what’s happening inside the company, enabling a seamless connection through data-driven personalization.

Expansion → hiring spike → operational strain → perfect outreach moment.
Funding → engineering growth → new product sprints → perfect outreach moment.
Layoffs → efficiency focus → consolidation → perfect outreach moment.

This context isn’t guesswork. It’s watching a story unfold in real time.


What Outreach Sounds Like When It’s Truly Contextual

Instead of generic lines like:

“Wanted to reach out because we help companies like yours…”

You write:

Expansion + hiring
“Saw you’re expanding into Ghana and opening several Ops and Support roles. Teams usually run into X during the first 90 days… & here’s how others manage it.”

Funding + engineering growth
“With the recent funding announcement and backend hiring spike, it looks like the engineering team is preparing for new product cycles. Here’s how others speed up Y during this stage.”

Layoffs + targeted hiring
“Saw the reductions in X but continued hiring in Y. That typically signals a shift toward efficiency. Here’s what’s working in similar transitions.”

This is how personalization in real-time data works in practice.


Automating the Workflow

Implementing this doesn’t require a complex stack:

  • Fetch new jobs daily
  • Fetch relevant news events daily
  • Link them by company
  • Trigger outreach based on time proximity or categories
  • Push dynamic messaging into your outbound tool

PredictLeads’ schema is built in a relational way, so combining these signals is straightforward.


Why It Works

Personalization isn’t about writing someone’s name twice.
It’s about reflecting a company’s real-world situation with accurate data in real time.

Real-Time Data Personalization creates relevance, and relevance is what makes outreach convert.

5 AI Agents you can connect with PredictLeads to automate smarter (and skip the boring stuff)

Most automation tools are only as good as the data you feed them. PredictLeads focuses on providing that missing piece – clean, structured company data that can actually make automations useful. The integration with AI automation tools offered by PredictLeads allows you to surface things like job openings, tech stacks, funding events, and company news, so your workflows can react to what’s happening in real-time. Whether you’re using APIs or no-code integrations, PredictLeads helps you gain valuable insights.

You can connect PredictLeads to your favorite AI agents and automation tools such as Activepieces, n8n, Make.com, Zapier, and Bardeen.ai to make your workflows actually smart, not just automated.

Example of an automated workflow combining PredictLeads data with OpenAI and Google Sheets through Activepieces.

1. Activepieces

If you haven’t tried Activepieces, think of it as open-source Zapier that’s simple and powerful.

The new PredictLeads integration lets you pull company insights and trigger actions across hundreds of apps. You can:

  • Enrich CRM records when a new company domain shows up.
  • Post in Slack when one of your tracked companies adds several new job openings.
  • Notify your sales team when PredictLeads detects a new funding event using PredictLeads integration with AI automation tools.

Available PredictLeads actions:

  • List Companies
  • List Job Openings
  • Get Company by Domain
  • Retrieve Companies by Technology
  • Get News Event
  • List Company News Events
  • List Technologies by Domain
  • List Connections
  • Make Custom API Calls

You can start experimenting with it directly on Activepieces. No code, no setup pain.


2. n8n

n8n is great when you want more logic and control in your automations.

This tool allows for PredictLeads integration with AI automation features to blend seamlessly with CRMs, Slack, Google Sheets, or your custom systems.

Example ideas:

  • Automatically find companies hiring for “AI Engineers” and send them to your CRM.
  • Get alerts when portfolio startups start scaling their teams.
  • Filter PredictLeads data to show only companies that match your target tech stack.

n8n is for those who like to see the inner workings of their automation instead of just hitting “run.”


3. Make.com

Make.com (formerly Integromat) is perfect if you prefer visual workflows.

By connecting PredictLeads, you can:

  • Pull new job openings, check if they fit your ICP, and push them into your CRM.
  • Watch for technology changes like new marketing tools detected on company websites.
  • Create a live dashboard that tracks companies hiring for data roles in your target region through PredictLeads integration with AI automation tools.

Make.com turns PredictLeads data into visual, flowing automations that are easy to understand.


4. Zapier

Zapier might be the old classic, but it’s still the easiest starting point for most.

You can set up simple PredictLeads automations such as:

  • Adding new job openings to Google Sheets.
  • Sending outbound leads to Notion when they meet specific filters.
  • Getting Slack notifications when a company is mentioned in PredictLeads News Events with the advantages of PredictLeads integration with AI automation tools.

Zapier works great when you want to get started quickly and don’t need complex logic.


5. Bardeen.ai

Bardeen.ai is an AI agent that automates your browser.

Combine it with PredictLeads data and you can:

  • Scrape company lists from the web and enrich them instantly.
  • Build prospect lists based on who’s hiring and send them into your CRM.
  • Write personalized outreach messages using PredictLeads company data integrated with AI automation tools.

It’s the easiest way to use PredictLeads data directly from your browser while staying in flow.


TL;DR

PredictLeads gives you the data.
Activepieces, n8n, Make, Zapier, and Bardeen give you the automation.

Put them together and you can:

  • Build lead lists automatically.
  • Track hiring trends across your ICP.
  • Get alerts before competitors do.
  • Automate the parts of prospecting that nobody enjoys.

If you want to test it out, check the PredictLeads integration on Activepieces or dive into the full API docs at docs.predictleads.com/v3

How Marketing Teams Can Use Technology Data to Spend Less and Convert More

Most marketing budgets are spent on the wrong companies.
Teams define their audience by industry, size, or location, but those filters don’t tell you much about whether a company is actually a fit.

Two businesses can look identical on paper and still be worlds apart in how they operate.
One might have a modern stack built around HubSpot and Stripe.
The other could be using outdated tools that don’t connect with anything.
Both will appear as “software companies,” yet only one can realistically buy what you’re selling.

This is where data about a company’s technology usage becomes useful. It helps you see what’s underneath the surface.


Understanding Technology Stack Insights

Every company leaves small digital traces of the software it uses.
These traces appear on websites, subdomains, job descriptions, and DNS records.
When you combine those signals, you can build a reliable picture of a company’s technology stack.

PredictLeads tracks a billion of these detections across more than sixty million companies.
Each detection shows which tool a company uses, when it was first seen, and when it last appeared.
Over time, this data forms a clear timeline of how that company’s tools change and evolve.

For marketers, that view is valuable because it lets you stop guessing.
You don’t need to assume who your product fits.
You can filter for companies that already use related technologies or competitors.

Technology data showing patterns across company stacks.

Better Targeting Starts with Simple Filters

Say you’re marketing software that integrates with Salesforce.
With technology data, you can instantly filter for companies that use Salesforce, HubSpot, or Pipedrive.
Now every company you contact is technically ready to use your product.

If you’re running paid campaigns, you can exclude everyone else.
That means less wasted budget and a smaller but more accurate audience.

Instead of spending $10,000 on 10,000 random clicks, you might spend the same amount reaching 2,000 companies that actually have a chance to convert with adopting a data-driven marketing approach.


Making Segmentation Practical

Technology data can improve more than ad targeting.
You can use it to refine email lists, prioritize leads, or adapt your messaging.

If your data shows that a company recently added a tool your product connects to, you can reach out with something relevant to that setup.
If another company is using an older competitor, you can adjust the message toward migration.

These are small shifts, but they make communication feel informed rather than generic.
Instead of another “we help SaaS teams grow faster” email, you can send a message that clearly fits the company’s environment.


Reducing Spend and Improving Conversion

When campaigns reach the right people, costs naturally go down.
With data-driven marketing you spend less per qualified lead, and the leads you do attract are more likely to move forward.

Marketing metrics improve not because of better creative or higher budgets, but because the audience is better defined.
Sales teams waste less time chasing mismatched prospects.
Both departments work with cleaner data and clearer signals.


What This Looks Like in Real Life

A small team used PredictLeads’ Technology Detections dataset to focus on companies already using Stripe and Segment.
Their product connected directly with both tools, but before this change, most of their leads came from companies using completely different systems.

After applying the filters, the number of leads dropped by more than half.
However, their conversion rate tripled, and the average deal size increased.
They didn’t expand reach — they focused it.


A Simpler Kind of Data-Driven Marketing

There’s a lot of talk about data-driven marketing and technology stack insights, but in practice it often means adding more dashboards and complexity.
Technology usage data is the opposite.
It’s simple context since it’s a way to understand who can actually benefit from what you sell.

The best part is that you don’t need to change your entire marketing system.
You can enrich your existing CRM or lead lists with technology data and start filtering immediately.
It works quietly in the background, supporting the tools you already use.


Final Thoughts

Marketing becomes more effective when you stop treating every company as a potential customer.
Technology stack insights help narrow the focus to businesses that already have the systems, integrations, and maturity level to use your product.

You don’t need to guess who’s a fit anymore.
You can see it.

And once you see it, everything from ad spend to conversion rate starts to improve — not through growth hacks or new tools, but through better understanding of the companies you’re trying to reach.

Got a question? Our team at PredictLeads will be happy to help.

How to Choose a Historical Data Provider?

Choosing a historical data provider comes down to coverage, timestamp fidelity, lifecycle tracking, provenance, and licensing fit. PredictLeads provides time-stamped company signals such as Job Openings, Technology Detections, News Events, Financing Events, and Vendor/Partner/Investor Connections. Each record includes granular first_seen, last_seen, found_at, and published_at fields, along with rich categories. The data is delivered through APIs, FlatFiles and webhooks, which makes it easy to build reproducible backtests, ICP models, and RevOps playbooks.


Why a “historical” view matters (and what it is not)

If you’re evaluating historical data for B2B go‑to‑market, investing, or partnerships, your goal isn’t tick‑by‑tick market feeds. It’s who did what, when, and for how long. E.g., when a company started hiring for a role, when a technology first appeared on their site, when a partnership was announced, or when a funding round was published. That requires:

  • Event‑level timestamps that support causal analysis (e.g., jobs spike → outreach → meeting → opportunity).
  • Lifecycle states so you can see what’s active now and what existed in the past (avoid survivorship bias).
  • Provenance so every signal is explainable and defensible (source URLs, categories, and context).

For GTM decisions, event recency and duration usually matter more than intraday speed. If you can align a first_seen_at with an action you took, you can attribute lift.


The evaluation framework

1) Coverage & provenance

Ask: Which signals and geographies are covered? Can I inspect source URLs and confidence? Are categories normalized?

PredictLeads coverage (examples):

  • Job Openings: titles, categories (incl. O*NET mapping), location, salary fields, first_seen_at/last_seen_at, active/closed flags.
  • Technology Detections: tech name, version where available, first_seen/last_seen, subpage context, optional behind‑firewall hints.
  • News Events: normalized categories (e.g., acquisitions, partnerships, launches, headcount, expansions, awards), found_at, linked article URL.
  • Financing Events: amounts, round types, investors, first_seen_at.
  • Connections: normalized relationship types (vendor, partner, integration, investor, parent, rebranding, published_in, badge, other).

2) Timestamp fidelity & auditability

History is useful only if you can trust when things happened. Prefer datasets with event‑level timestamps (e.g., first_seen_at, last_seen_at, found_at, published_at) and clear rules for “active,” “closed,” and “deleted.” Distinguish source publish time from discovery time for honest backtests.

3) Granularity & lifecycle tracking

Look for record lifecycle: created → updated → closed/deleted. For hiring, you’ll want active/closed and last_seen_at to infer fill times; for tech adoption, you want first_seen and last_seen to understand churn and stickiness.

4) Normalization & enrichment

Categories unlock use cases: job families (Sales vs Eng), O*NET for role families, news event categories, connection types, and financing round types. Normalization reduces your downstream modeling effort and boosts precision.

5) Delivery & operational fit

API, webhooks or flat files. Prefer JSON/REST with clear pagination, idempotent endpoints, rate‑limit headers, and meta.count. For batch, support for incremental windows (e.g., found_at_from), and stable IDs.

Clarify whether you can: use data in internal models, trigger outreach, share derived analytics, or redistribute subsets. Ensure the license reflects your actual workflows.


How PredictLeads maps to the checklist

Job Openings

  • Fields: title, categories, onet_code, location_city/country, salary_low_usd/salary_high_usd, first_seen_at, last_seen_at, active_only, not_closed.
  • Uses: hiring intent, geo expansion, seniority mix, comp banding, time‑to‑fill.

Technology Detections

  • Fields: technology_name, subpage, confidence_score, first_seen, last_seen.
  • Uses: tech adoption, competitive intel, ecosystem scoring.

News & Financing Events

  • Fields: category (partners_with, launches, acquires, increases_headcount_by, expands_offices_to/in, raises_funding), found_at, published_at, amount, round_type.
  • Uses: intent, timing outreach, portfolio scouting.

Connections (vendor/partner/investor)

  • Fields: relationship_type (vendor, partner, integration, investor, parent, rebranding, published_in, badge, other), source_url, first_seen_at.
  • Uses: partner ecosystem maps, channel strategy, integration‑led growth.

Why this matters: With continuous first_seen/last_seen and strong categories, you can write reproducible rules like: Companies with ≥3 new engineering roles in the last 14 days AND a newly detected HubSpot integration → high‑priority outreach.


Example playbooks

1) Hiring momentum filter

  1. Pull last 90 days of engineering jobs for a domain list with active_only=true.
  2. Aggregate by domain/week; keep domains with ≥5 new roles/week and salary_low_usd ≥ X.
  3. Join with Technology Detections (e.g., Salesforce, HubSpot, Snowflake) for stack fit.

Outcome: A short‑list of fast‑growing, ICP‑fit accounts with concrete talking points.

2) Partner ecosystem map

  1. Query Connections for relationship_type in [vendor, partner, integration].
  2. Rank vendors by breadth and first_seen_at recency.
  3. Enrich with News Events for fresh announcements to personalize outreach.

Outcome: Find co‑sell angles and integration‑led ABM plays.

3) Expansion alerts

  1. Listen to News Events for expands_offices_to/in or increases_headcount_by.
  2. Cross‑check Job Openings spikes in those geos.
  3. Route accounts to reps by territory; trigger sequences with geo‑specific messaging.

Outcome: Time outreach to moments of budget and urgency.


Common traps (and how PredictLeads addresses them)

  • Survivorship bias: Only looking at what’s live today hides closed roles and churned tech. PredictLeads tracks historical states and last_seen timestamps.
  • Opaque provenance: Without source_url, confidence, and page context, you can’t justify a signal. PredictLeads links back to sources and captures context.
  • Schema drift & rework: Hand‑built normalizers break. PredictLeads ships normalized categories (job families, news types, relationship types) to cut integration time.

Implementation blueprint (90‑minute setup)

  1. Pick signals: Start with Jobs + Tech + News for your ICP.
  2. Define windows: e.g., found_at_from last 30/90 days; keep active_only where applicable.
  3. Build joins: Domain key across signals; keep first_seen/last_seen fields in your warehouse.
  4. Score rules: Combine recency (days since first_seen), volume (event count over 7 or 14 days), and context (technology stack fit or partner relevance).
  5. Route & measure: Push scored accounts to CRM, track meetings/opps sourced.

Conclusion

Historical data that drives revenue must be explainable, time-stamped, and normalized. PredictLeads focuses on the company‑level events that matter. Look for who’s hiring, adopting tech, partnering, raising, launching, and changing their site. Such timestamps and lifecycle states you need to trust your models and take action.

Ready to see your history‑powered pipeline?
• Explore the API docs: https://docs.predictleads.com/guide
• Ask us for a sample: https://predictleads.com/#demo


About PredictLeads

PredictLeads indexes 98M+ companies and delivers normalized, time‑stamped signals to help GTM and investment teams find and act on buying windows. We provide APIs, webhooks, and flat files; therefore, you can wire signals directly into your workflows.

How Consultants Can Use PredictLeads’ Key Customers Dataset for Competitive Advantage

In the consulting world, understanding a client’s ecosystem is everything. Whether you’re advising on growth strategy, market positioning, or partnership opportunities, your recommendations are only as good as the data behind them. That’s where PredictLeads’ Key Customers Dataset comes in – providing an unparalleled window into the companies your clients rely on and the ones relying on them.

What Is the Key Customers Dataset?

The Key Customers Dataset identifies which companies are customers of which. It surfaces business relationships – for example, which firms use HubSpot, AWS, or Snowflake – based on verified digital evidence such as logos, case studies, testimonials, job posts, or partner listings.

Each record helps you see:

  • Who buys from whom
  • The type and depth of the relationship
  • When the connection was first detected or last updated

This dataset connects millions of companies globally, revealing commercial dependencies that often go unnoticed in traditional research.

Logos of companies using PredictLeads data, including Dealroom, Clay, and FactSet.

Why It Matters for Consulting Firms

Consultants thrive on context. Understanding a client’s customer and partner landscape allows for sharper insights, faster audits, and more targeted recommendations. Here are some specific consulting use cases:

1. Market Mapping & Competitive Benchmarking

By analyzing the customers of your client and their competitors, you can identify:

  • Which verticals or regions your client underperforms in
  • The industries that competitors dominate
  • Emerging players gaining traction with shared customers

For instance, if your client competes with HubSpot, you could analyze thousands of its key customers to uncover underserved segments or new partnership opportunities.

2. M&A Target Screening

When evaluating acquisition targets, consultants can quickly assess:

  • Overlap or synergy between customer bases
  • Potential cross-sell opportunities
  • Concentration risk (e.g., 70% of revenue tied to one customer cluster)

This reduces manual research and brings data-driven precision to strategic decision-making.

3. Customer Retention & Expansion Planning

For growth-focused consulting, understanding a client’s current customers (and who else they buy from) enables tailored expansion strategies.
Example: If a SaaS client’s customers also use 3–4 competing platforms, that’s a signal to strengthen retention tactics or upsell integrations.

4. Partner & Ecosystem Strategy

Advisors helping clients build alliances or reseller programs can identify:

  • Which companies have overlapping customer ecosystems
  • Where indirect partnerships already exist through shared clients
  • Which verticals offer the strongest growth potential

Example: Turning Data into Strategy

Imagine a consulting firm advising a cybersecurity company. Using PredictLeads’ Key Customers Dataset, the consultant identifies that most of their top customers are also working with AWS and Snowflake … suggesting an opportunity to develop integrations or co-marketing campaigns within those ecosystems.

In another case, the dataset could reveal that a client’s competitor just signed multiple fintech customers in Southeast Asia, hinting at regional momentum worth investigating.


Why PredictLeads?

PredictLeads doesn’t just collect data but it maps business relationships across millions of verified signals.
The Key Customers Dataset integrates seamlessly with other PredictLeads datasets (e.g., Job Openings, Technologies, or News Events), allowing consultants to layer insights:

  • Who are a company’s biggest customers?
  • What technologies do they use?
  • Are they hiring for new markets or functions?

Together, these datasets paint a holistic picture of where your client stands – and where they can move next.


Final Thoughts

For consulting firms, the Key Customers Dataset transforms relationship intelligence into strategic foresight. Instead of relying on assumptions or fragmented public data, consultants can now map entire customer ecosystems, quantify competitive positions, and identify actionable growth paths – all with data that’s refreshed continuously.

Hydrogen is hiring: what the PredictLeads Jobs dataset says about sector health in 2025

If you want to know whether a sector is actually moving, don’t start with hype – start with hiring. We used the PredictLeads Jobs dataset (last 3 months) across leading hydrogen names to “nowcast” sector health. The takeaway: deployment is real, and it shows up in job titles first.

TL;DR

  • The PredictLeads Jobs dataset shows strong and recent hiring activity at major hydrogen companies, particularly in roles connected to deployment such as field and service positions, manufacturing, and engineering.
  • External market signals are consistent with what the hiring data reveals. The Global X Hydrogen Exchange Traded Fund (ticker symbol HYDR) has risen in 2025, reflecting investor optimism in the hydrogen sector. The International Energy Agency reports that hydrogen demand continues to grow and that there has been a wave of projects reaching the stage of Final Investment Decision, where companies formally commit capital to build. In parallel, the European Union Hydrogen Bank is providing funding for additional renewable hydrogen production capacity.
  • Falling interest rates are providing a supportive backdrop for capital-expenditure-intensive technologies such as hydrogen. The European Central Bank reduced its benchmark interest rate by 25 basis points in both March 2025 and April 2025, and the United States Federal Reserve lowered its policy rate in September 2025.

From job ads to energy shifts: What hiring tells us about the future of hydrogen.

What the PredictLeads Jobs dataset shows (last 3 months)

Air Liquide, Bloom Energy, and Plug Power are the backbone of current hiring:

  • Air Liquide: Fresh postings spike into September – a classic “projects greenlit → staff up” seasonality you expect when deployments move.
  • Bloom Energy: Steady month-over-month momentum. Stack R&D + manufacturing roles show factories and product lines scaling.
  • Plug Power: Heavy field & service footprint (commissioning, technicians, sustaining). That’s boots-on-the-ground work (aka real deployments).

Across companies, the role mix skews toward:

  • Field & Service → signal of installs, commissioning, and uptime SLAs.
  • Manufacturing → signal of throughput and factory capacity.
  • R&D & Engineering → ongoing stack, electrolyzer, and balance-of-plant improvements.

Why this matters: when a sector shifts from “talk” to “deploy,” job titles change first. The PredictLeads Jobs dataset is the fastest way to catch that turning point.


External confirmation the sector is moving (beyond our dataset)

Market proxy — HYDR ETF. The Global X Hydrogen ETF is up in 2025 on common trackers. That doesn’t prove revenues company-by-company, but it’s a clean risk sentiment read that aligns with our hiring picture.

IEA’s 2025 view – The IEA Global Hydrogen Review 2025 reports demand rising to ~100 Mt in 2024 and highlights 200+ FIDs through end-2024, i.e., a pipeline that naturally pulls hiring in engineering, manufacturing, and service. Growth is uneven, but the trajectory and investment signals are there. (FID being Final Investment Decisions)

EU Hydrogen Bank funding. The second auction drew strong interest and awarded ~€1 billion to 15 projects across the EU – another “real money → real people” link that matches the roles we see in the Jobs dataset.


Why rate cuts matter (and help what we’re seeing in the jobs data)

Hydrogen projects are capital-intensive. Lower rates improve project IRRs and make financing/offtake less painful. In 2025:

  • ECB reduced interest rates by 25 basis points in March and again in April which shows support for EU project finance.
  • Fed delivered its first 2025 cut in September – a broader risk-on nudge that tends to help thematics like H₂.

How to use the PredictLeads Jobs dataset like a pro

Steal this mini-playbook:

  1. Nowcast sector health
    Build a simple monthly postings index for a curated “Hydrogen 20” basket. Watch the mix shift from R&D → Field/Service/Manufacturing to know when deployments ramp.
  2. Commissioning heatmap
    Filter titles for “field”, “service”, “commissioning”. Map locations to see where projects are turning on. Use it for partner targeting and on-the-ground ops.
  3. Capacity & supply chain
    Track manufacturing roles (operators, line leads, welders). That’s your proxy for throughput and vendor demand coming down the chain.
  4. Talent & wage checks
    When ranges are present, parse & annualize to benchmark pay (useful for staffing, contractors, and budgeting).
  5. Bridge to markets (optional)
    Overlay your postings index with HYDR monthly returns and test 0–3-month lags. Hiring responds slower than prices, but the direction should rhyme if you’ve got the basket right. (The widget above lets you keep an eye on HYDR in real time.)

Bottom line

Hiring is one of the cleanest early signal we have. In hydrogen, the PredictLeads Jobs dataset shows the shift from “talk” to deploy: more field/service, more manufacturing, steady engineering. That’s what real projects look like from the inside.


Who we are (and why this works)

PredictLeads is a data provider focused on commercial signals (Jobs, News, Technologies, and more) delivered via API, FlatFiles and webhooks so you can plug insight directly into your models, decks, or ops. No platform to learn, just the data you need.

If you’re exploring hydrogen (or any sector where deployment beats hype) use the PredictLeads Jobs dataset as your lead signal.
Docs: https://docs.predictleads.com/v3

« Older posts

© 2026 PredictLeads Blog

Theme by Anders NorenUp ↑